The Leaderboard, who makes the market's lists most often
On this page
Movers shows who moved today. The Leaderboard shows who keeps showing up: it counts, day by day, how often each stock has made the market's daily lists, and ranks them.
#Biggest movers
Open Leaderboard in the Finance section bar, or select Leaderboard on the overview's Frequent movers card.
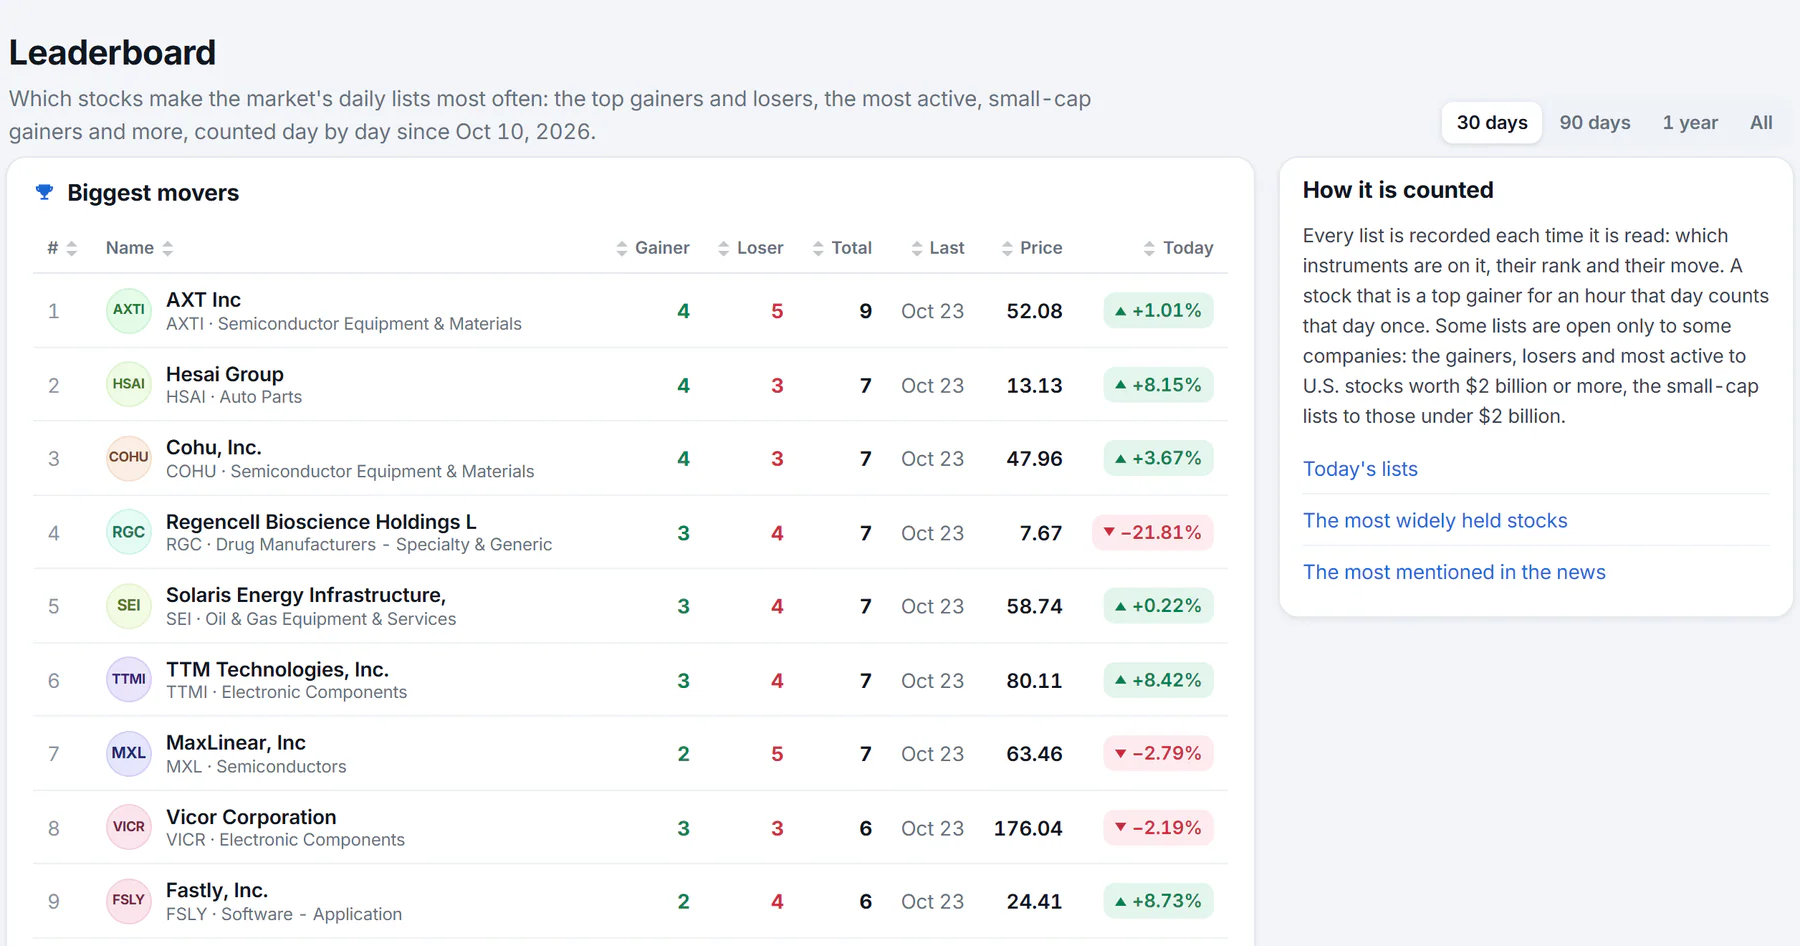
Stocks ranked by the number of days they made the gainers or losers lists. Green is days among the top gainers, red days among the top losers.
- 1Choose how far back to count
- 2Days among the top gainers
- 3Days among the top losers
- 4The stock that made the lists most often
The first card counts days. For each stock it shows:
- Gainer: days it was among the top gainers.
- Loser: days it was among the top losers.
- Total: the two together.
- Last: the most recent day it made a list.
- The current Price and Today's change.
A day counts when the stock ranked in the top 25 of a list at least once that day, so a stock that was a top gainer for an hour counts that day once.
Use the buttons at the top right to choose the window: 30 days, 90 days, 1 year or All, which runs from when tracking began. The page says the date, and when tracking covers fewer days than the window, how many days there have been so far.
#Every list
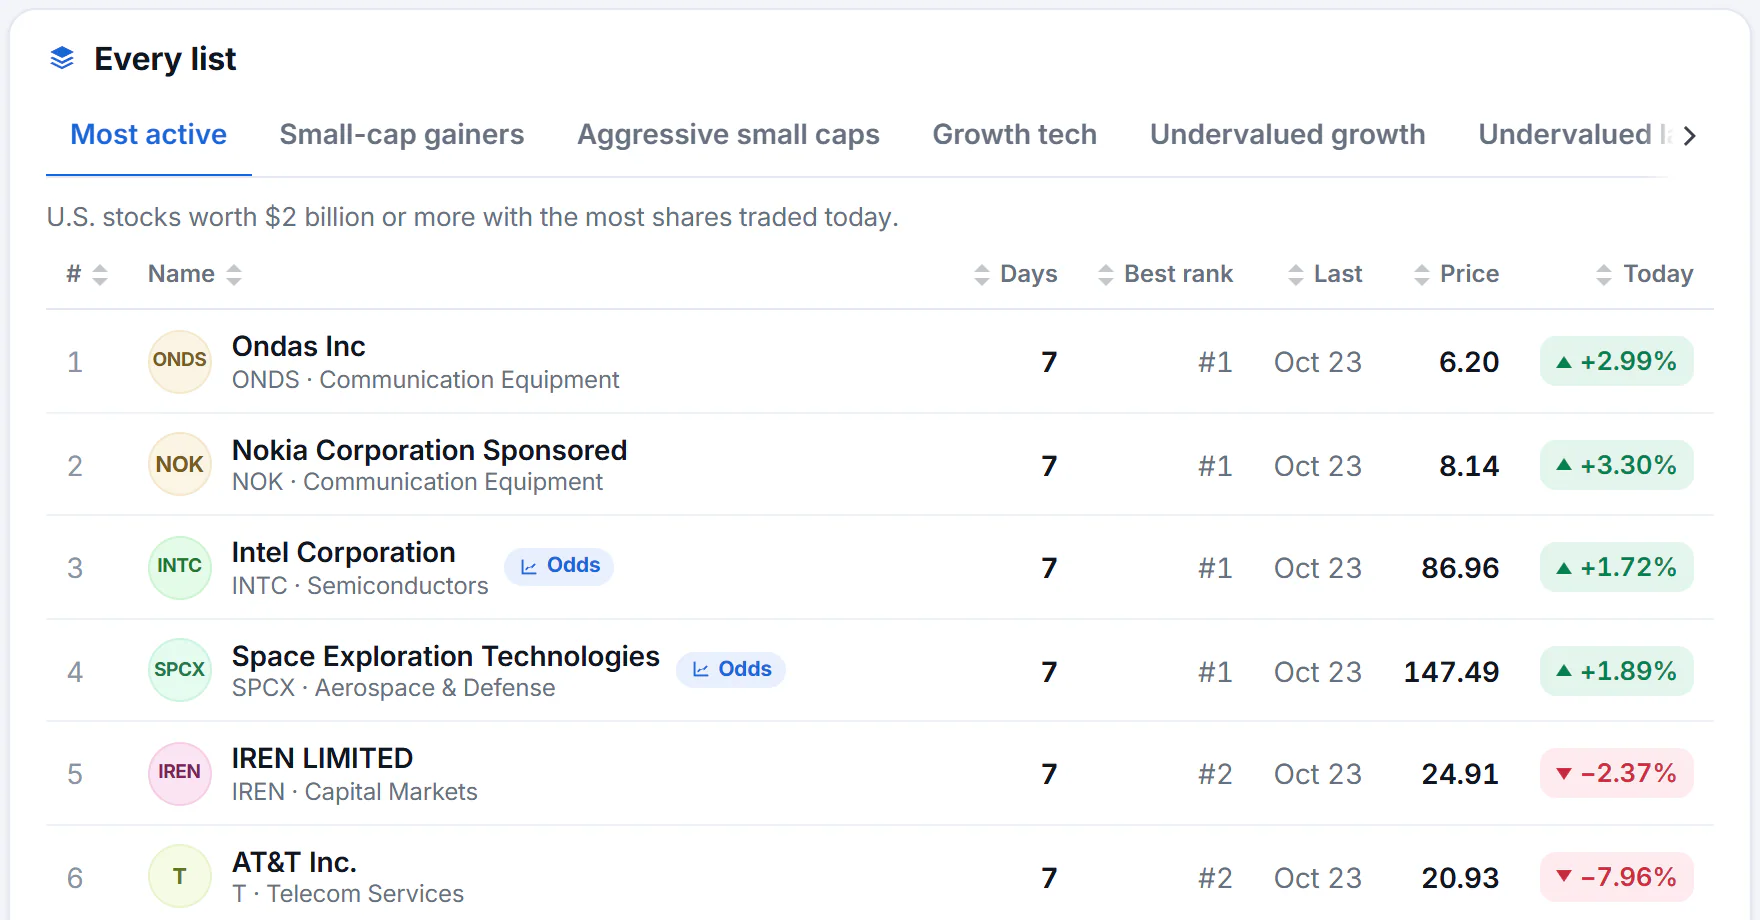
One tab per list. A line above the table says what is on the list.
- 1One tab for each list
- 2Who can be on this list
Under Every list are tabs for each of the day's lists, such as Most active, Small-cap gainers, Aggressive small caps, Growth tech, Undervalued growth, Undervalued large caps, Most shorted, Most widely held, Trending, ETF gainers, ETF losers, Most active ETFs, the coin lists and Top mutual funds. The tab row slides sideways when it does not fit.
Each table gives the days on the list in the window, the Best rank reached and the Last day on it. Lists of percentage gainers or losers also show the Avg move, the stock's average move on the days it was listed. On Most shorted, Short % of float shows how much of the stock is sold short.
Some lists are open to some companies only. The gainers, losers and most active lists cover U.S. stocks worth $2 billion or more, and the small-company lists cover those under $2 billion. The How it is counted card on the right explains this.
The lists are read every few minutes while U.S. markets trade. The coin lists run around the clock, and the fund and short-interest lists are read daily.
#A single stock's record
On a stock's page, the Track record card shows the same counts for that stock. See Peers, related companies and track record.
#Common questions
Why does the Leaderboard say it covers only a few days?
Tracking began on the date shown at the top of the page. Longer windows will fill in over time.
Is a stock that is often a top gainer a good buy?
Not necessarily. It tells you the stock moves a lot, in either direction. Nothing on Finance is investment advice.
What does "short" mean?
Selling a stock you do not own, in the hope of buying it back cheaper later. A high short percentage means many investors are betting on a fall. See Key statistics, explained.